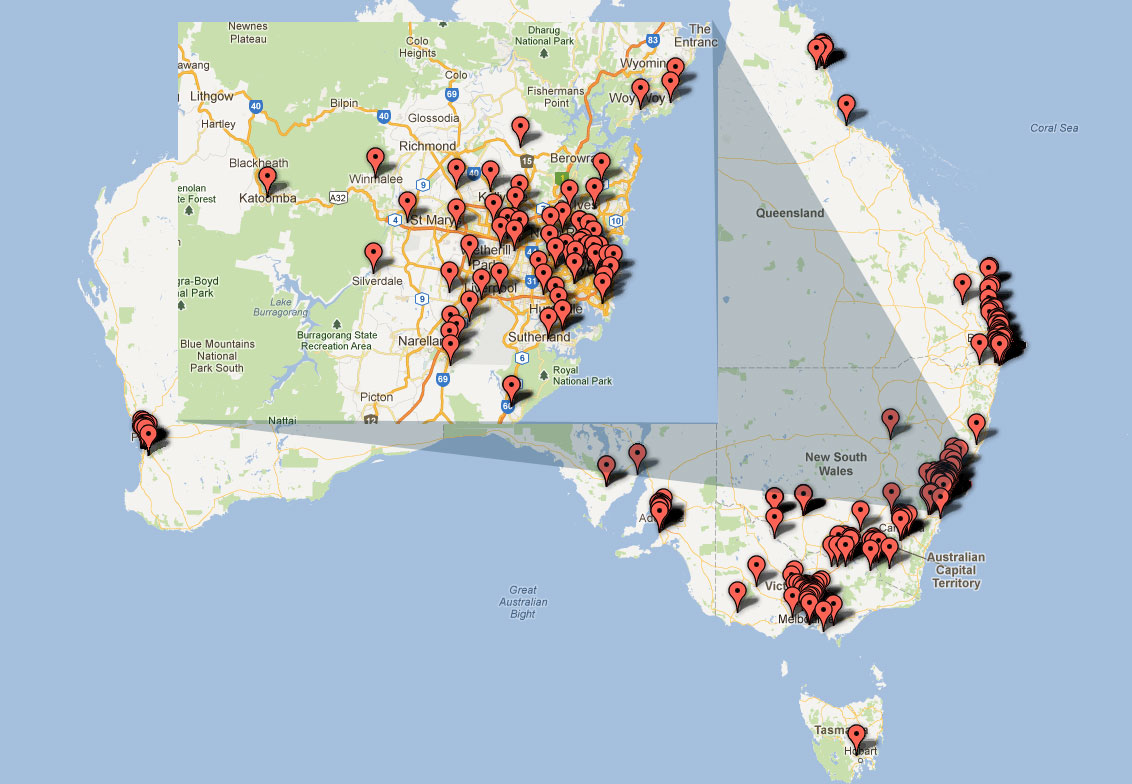
Here’s a neat trick.:
- Export all your clients into an excel or CSV list of suburbs / cities. Or their entire address in one field for best results. Make sure the top Row has labels and the geographic one is called “Address”
- Login to Google DOCs (but not via a google apps account, a personal gmail should work)
- Click on CREATE -> Table (BETA)
- Upload the CSV
- Click NEXT to confirm the data looks ok
- Click “View in Experimental”
- At this point it may identify the city or address field which will show up as a map “Tab” you can click on, otherwise you can hit + and define the field to map the “address” column
- Voila! A Beautiful, navigable map of your clients! Results may vary in the “experimental” mode, so you can always flick back to classic and try the Visualize -> Map method as well.

1 Comment. Leave new
Nice one! Totally using this one at work.